Determinants of Dividend Policy: Empirical Evidence from Nigerian Listed Firms
Determinants of Dividend Policy: Empirical Evidence from Nigerian Listed Firms
Alaeto Henry Emeka/Volume 13/Issue 2/(April-September 2020)

1.0 INTRODUCTION 1.1
Background of the Study Dividend policy is one of the most critical topics that has been subject to extensive research in the field of corporate finance. Dividends can be in the form of cash, giving away free stocks (bonus issue) or repurchasing shares (Arnold, earnings as it meets the liquidity needs of investors and sends vital information to shareholders about the current and future prospects of a firm (Pandey, 2004). However, cash dividends may reduce the amount of funds retained by a company to finance its future
growth and investments; this may force a company to have more external borrowing which may lead to more regulatory scrutiny and higher costs of financing (Ozo, 2014).
The issue of determining the optimal payout has been debated among scholars in the corporate finance discipline for decades (Brealey and Myers, 2002). Addressing this challenge, there are broadly two schools of thoughts: the dividend irrelevance theory and dividend relevance theory. According to dividend irrelevance theory, postulated by Miller and Modigliani (1961) and supported by Black and Scholes (1974), dividend policy does not matter and therefore does not affect the value of firm. On the other hand, dividend relevance theorists have argued that dividend policy does matter and as such, affects firm value (Gordon 1959, 1962; Friends and Puckett, 1964; Bhattacharya, 1979).
Several theories such as bird-in-hand theory (Bhattacharya, 1979), clientele effect (Bhattacharya, 1979), agency problems (Jensen and Meckling, 1976), and catering theory (Baker and Wurgler, 2004a) have been developed and empirically tested in developed countries (e.g. Fama and French, 2001; Baker and Powell, 2012). In addition, more recent studies have found that corporate dividend policies vary across countries and are influenced by institutional factors such as political instability, corruption, corporate governance, regulatory framework, and taxes (e.g. Booth and Zhou, 2017). Furthermore, empirical findings suggest that firms in the emerging economies face more ‘financial constraints’ than their developed counterparts which may lead to low dividend payouts (Ramacharran, 2001; La Porta et al., 2000; Aivazian et al., 2003). Moreover, some studies suggest that the industry classification effect may influence dividend payouts (Barclays et al., 1995; Baker et al., 2001; Baker et al., 2008). These factors provide an extra motivation to examine the determinants of dividend payouts in the context of the Nigerian market within the Sub-Saharan Africa, which will assist in enlightening debates on comparable research issues in the field of corporate finance. In order to examine the influence of the institutional environment, several studies have been conducted in Nigeria to identify the determinants of dividend policy for certain industrial sectors (e.g. Okoro, Ezeabasili and Alajekwu, 2018; Bassey, Atairet, and Asinya, 2014; Uwuigbe, 2013). For example, Bassey, Atairat, and Asinya (2014), studied the determinants of commercial banks’ dividend payouts. They found that leverage, earnings, and size were positively correlated to dividend payout. In addition, Okoro, Ezeabasili, and Alajekwu (2018) examined the determinants of dividend payouts of consumer goods firms listed on the Nigerian Stock Exchange (NSE) and found that dividend payouts were negatively correlated to firm size, leverage and profitability. However, none of these studies examined the determinants of dividend payouts of non-financial Nigerian listed firms; instead, they have either focused on financial service firms, or on specific sectors such as consumer goods, or oil and gas, with only a limited sample. Therefore, these deficiencies in research show that significant gaps exist in the literature, which this research seeks to fill.
For this purpose, the current paper contributes to the existing literature by providing insight into the institutional environment within the Nigerian market and also fills the gap in knowledge by examining the determinants of dividend payouts of non-financial sectors from 2013 to 2017. 1.2 Statement of the Problem and Rationale for the Study There are many reasons why the researcher considered investigating the determinants of dividend payouts of non-financial firms listed on the Nigerian Stock Exchange. Firstly, to the best of researcher’s knowledge, prior studies on dividend policies and their determinants in Nigeria have focused on either the oil and gas sector (e.g. Zayol and Muolozie, 2017) with nine firms over a period of five years from 2011 to 2014 or consumer sectors (e.g. Kajola et al., 2015) with nine firms from 1997 to 2011. Secondly, evidence from the literature reviewed (e.g. Aivazian, 2003; Booth and Zhou, 2017) seems to suggest that limited studies have been done in the emerging markets of Sub-Saharan Africa, like Nigeria, despite the extensive dividend studies carried out in developed countries such as the UK, US, Australia and Canada. For this reason, there is limited knowledge of the determinants of dividend payouts in the emerging markets (Aivazian, 2003). Indeed, there are several reasons why the results found in developed countries may not hold true in developing countries. For example, empirical evidence from the literature suggests that factors surrounding the institutional environment, such as political instability, taxation, corporate governance, and the financial system may mean that results in the developed countries vary from those in the developing countries (Booth and Zhou, 2017; Glen et al., 1995; Ozo, 2014). Finally, most of the dividend studies conducted in Nigeria are based on the financial sector because of data availability and stricter regulations, while fewer studies concern the non-financial sector (Ozo, 2014). However, findings from the literature suggest that industry classification may influence the determinants of dividend payout (Barclays et al., 1995; Baker and Powell, 1999; Baker et al., 2001). These deficiencies represent a huge gap in literature especially in developing countries, which this current research seeks to fill. In order to address this, the current study uses an ‘up-to-date sample’ of all the listed companies on the Nigerian Stock Exchange, excluding the financial service sector because of its regulatory framework and high debt-equity ratio, in order to provide further evidence on why determinants of dividend payouts of non-financial firms may vary from that of the financial firms listed on the Nigerian Stock Exchange, thereby contributing to the literature on dividend decisions. The next section presents the aim and objectives of the research.
1.3 Research Aim and Objectives The aim of this study is to examine the determinants of dividend payout of non-financial Nigerian listed firms. Other specific objectives are: 1. To review the theoretical and empirical literature on the dividend payout and its determinants in order to choose appropriate research design and develop research hypotheses. 2. To analyse the institutional environment of Nigeria and how it may affect the determinants of dividend payout of non-financial firms. 3. To examine the statistical correlation between the dividend payout of Nigerian non-financial listed firms and a set of firm-level determinants. 4. To evaluate the empirical results from this study in the context of previous theories and empirical findings.
2.0 LITERATURE REVIEW
2.1 Introduction
Dividend policy has been a subject of debate among academics and practitioners of corporate finance for decades, but no consensus has been reached (Baker and Powell, 1999). Many theoretical predictions have been put forward and empirically tested in order to explain why firms pay dividends, despite the difference in taxes on dividends and capital gains (Brennan, 1970; Elton and Gruber, 1970; Rozeff, 1982; Fama and French, 2001). One indicator of how challenging it is to understand dividend policy decisions, is evident in a comment by Black (1976, p.5):
‘The harder we look at the dividend picture, the more it seems like a puzzle, with pieces that just don’t fit together.’
In support of Black (1976), Allen et al (2000 p.2499) stated:
‘Although a number of theories have been put forward in the literature to explain their pervasive presence, dividends remain one of the thorniest puzzles in the field of corporate finance.’
Therefore, this section reviews existing literature on dividend policy and its determinants both in developed and developing economies in order to understand research in the field of corporate finance, and with a view to formulating testable hypotheses. The chapter comprises five sections: Section 3.2 presents theories of dividend policy; Section 3.3 covers the empirical literature on dividend policy in the developed markets; Section 3.4 focuses on the empirical studies on dividend policy and its determinants in developing economies; Section 3.5 reviews literature based on industry sectors; Section 3.6 covers dividend studies in Nigeria, and Section 3.7 concludes the chapter.
2.2 Dividend theories
The main theories underpinning dividend studies which are discussed are, firstly, dividend irrelevance theory, and then dividend relevance theory, information content (signaling) theory, followed by the bird-in-hand theory, clientele effects theory, tax preference theory, and agency cost theory. Finally, there is a summary of other dividend theories not directly related to the study but worth mentioning, such as catering theory, the maturity hypothesis and the residual theory of dividends.
2.2.1 Dividend Irrelevance Theories
There are many theories on dividends. But the most famous dividend theory was proposed by two American professors, Merton Miller and Franco Modigliani in their seminal work titled Dividend Policy, Growth and the Valuation of Shares and published in the Journal of Business (1961). According to them, the dividend policy of a firm does not affect the firm’s value, because once an investment decision has been made for the present and future period, any surplus earnings may be distributed as dividends to the shareholders. They further argued that it does not matter to a shareholder (he is indifferent to) whether he receives a cash dividend or sells part of his shares to raise cash, for with a perfect market and condition of certainty; he can decide what is important to him (either dividends or capital gains) based on his needs. A shareholder who is in need of cash could dispose (borrow) of part of his holdings (homemade dividend) to raise cash or lend a dividend if he so desires to defer consumption. In conclusion, the dividend irrelevance theorem was based on the premise of a perfect capital market where investors are assumed to be rational and dividend policy does not matter to the value of the firm. The dividend irrelevance theorem is supported by scholars such as Black and Scholes (1974) and Miller and Scholes (1982).
2.2.2 Dividend Relevance Theories
The proponents of dividend relevance theories believe that dividend policy affects the value of the firm. Gordon (1959) argued that in a world of uncertainty and imperfect markets, dividends matter and they are valued differently to capital gains. Therefore, he asserts that investors would prefer a current income to future income, because of uncertainty. Some of the supporters of dividend relevance theory include (Gordon, 1962; Elton and Grubber, 1970; Watts, 1973; Bhattacharya, 1979; Asquith and Mullins, 1983; Easterbrook, 1984; Benesh, Keown and Pinkerton, 1984; John and Williams, 1985; Miller and Rock, 1985). Further theories in support of dividend supremacy theory are discussed below.
2.2.3 Signalling (Asymmetric Information)
Theory of Dividend Payment The signalling hypothesis of dividend payment or the information content of a dividend is one of the theories that supports dividend relevance theory by suggesting that managers have a better knowledge of current and future prospects of the business than outsiders. In order to reduce information asymmetry, changes in the dividend may be used by them to signal future earnings and growth to the market. Therefore, an announcement about changes in the dividend could be interpreted by investors differently, depending on the type of news it carries. Lintner (1956) suggests that managers are interested in dividend signalling and only increase the dividend when they are convinced that earnings have increased. This suggests that a rise in dividend payouts indicates long-run sustainable earnings; which is consistent with the ‘dividend-smoothing hypothesis’. The signalling hypothesis was documented earlier but it was modelled in the late 1970s and mid-1980s by Bhattacharya (1979), John and Williams (1985) and Miller and Rock (1985). In particular, Bhattacharya (1979) suggested that the cost of signalling is the transaction cost incidental to the external borrowing, whereas Miller and Rock (1985) argued that the dissipative cost was the distortion arising from the optimal investment decision, and finally, John and Williams (1985) suggested that the signalling costs to a firm were the tax liability on dividends in relation to capital gains. In summary, Bhattacharya (1979) Miller and Rock (1985) and John and Williams (1985) suggested that dividend paying firms (value-firm) will command a higher market price than non-dividend paying firms (growth) because of the signalling effect of announcements.
2.2.4 Bird-in-Hand Theory Another
view in support of the dividend relevance theorem is the bird-in-hand theory. According to this theory, in a world of uncertainty and imperfect markets, a dividend is valued differently to capital gains. Therefore, investors will prefer the dividend payment (a ‘bird in the hand’) today rather than the ‘two in the bush’ (capital gains) because of uncertainty. Gordon and Shapiro (1956) suggest that shareholders will prefer a cash dividend payment to capital gains, and firms with high dividend payout ratios will have a higher market value. The rationale behind the theory is that, high dividend payout ratios are positively correlated with the market value of the firm. However, the-bird-in-hand theory has been challenged. For example, Miller and Modigliani (1961) argued that a firm’s risk is determined by the riskiness of its operating cash flows rather than the pattern in which earnings were distributed. Consequently, they disagreed with the theory by labelling it the ‘bird-in-the-hand fallacy’. Likewise Bhattacharya (1979) shares the same view as Miller and Modigliani (1961), by suggesting that the logic behind the bird-in-the-hand theory is fallacious. He went on to argue that firm dividend payouts are influenced by risk associated with cash flows, but any increase in dividend payouts would not reduce a firm’s risk. In conclusion, dividend payout decreases whereas the firm’s risk increases, which is inconsistent with the bird-in-the-hand theory.
2.2.5 Clientele Effects of Dividends
Another justification for dividend relevance is on the basis of taxes on dividends and capital gains. Clientele effects or the preferred habitat hypothesis was formulated on the premise that firms are made up of different clienteles ranging from dividend clientele, capital gain clientele, risk-based and transaction-based clientele, each having different reasons for investing in a particular firm (Miller and Modigliani, 1961). According to Miller and Modigliani (1961), investors might be influenced by certain market imperfections, for example, differential tax rates and transaction costs. They further argued that in the absence of taxes and transaction costs, dividends paid would not affect the firms’ value. On the contrary, they argued that the variation between taxes on dividends and capital might induce an investor to buy stocks of a firm that pays dividends in order to avoid the transaction costs associated with selling shares. However, in reality, there are different taxes on dividends, capital gains and transaction costs, and these differences may influence their clienteles. Earlier dividend theories tend to focus on two types of clientele effect, namely, transaction cost minimisation and tax minimisation.
• Tax-Induced Clientele Effects One of the arguments behind the dividend clientele hypothesis centred on the different tax treatment of dividends and capital gains. Prior studies argued that because dividends are often taxed at a higher effective rate than capital gains in most countries, investors already facing high marginal tax rates, or who cannot avoid paying taxes on dividends, may prefer not to receive cash dividends so as to minimise their tax liabilities (Brennan, 1970; Elton and Gruber, 1970; Litzenberger and Ramaswamy, 1979). Similarly, investors who can avoid paying taxes on dividends or face low margin tax rates do not mind receiving cash dividends (Han, Lee and Suk, 1999; Dhaliwal, Erickson and Trezevant, 1999).
• Transaction Cost-Induced Clientele Bishop et al. (2000) posit that investors such as retirees, income-oriented investors and others who depend on dividend income for their consumption needs might prefer high and stable dividend-paying shares to selling part of their shares, which could result in a significant transaction cost. On the contrary, some investors, particularly the wealthy, may not need dividend income to meet their consumption needs, and may therefore favour low or no dividend payouts, to avoid the transaction costs associated with reinvesting the dividends. Furthermore, transaction costs are involved when both groups of investors decide to move from one company’s shares to other types of security. However, Miller and Modigliani’s (1961) view that homemade dividends are free, does not hold true because in a real world transaction costs are involved when securities are traded (Scholz, 1992).
Similarly, another effect of transaction costs on dividend policy is based on fact that dividend payments are an outflow of cash which may be used for investment purposes. In other words, when a firm pays a cash dividend, they may have to rely on external financing in order to execute their investment, which may in turn involve costs. For instance, if a firm issues equity to raise cash for its investment programme, or resorts to debt financing, there are costs. If the costs of external financing are significant, it is likely that firms would prefer to use retained earnings rather than external financing, which supports the pecking order theory (Myers, 2000). Prior studies have identified transaction costs associated with dividends: Bhattacharya’s (1979) signalling model and Rozeff’s (1982) trade-off model are amongst the justifications for clientele effects of dividends. Thus Rozeff (1982) argued that companies with high levels of debt should adopt a lower dividend payout ratio as higher payouts are associated with higher transaction costs arising from the use of external financing. Therefore, on the basis of evidence from the literature, the dividend payout ratio and transaction costs are expected to be negatively correlated.
2.2.6 Agency Problems and Dividend Theories Agency
theory concerns the relationship between a principal and his agents (Arnold, 2005). The agency relationship often creates conflict which leads to agency problems (Jensen and Meckling, 1976) related, for example, to the cost of administration, restructuring and enforcing of contracts (Brealey, Allen and Myers, 2016). Ross et al. (2008) suggest that agency costs arise when managers try to enrich themselves at the expense of the owners or their creditors. Agency costs arising from conflicts between stakeholders in an organisation have been studied extensively. Prior studies have all investigated the impact of agency costs on the organisation and how the dividend payout ratio could be used as a tool for reducing agency costs (Jensen and Meckling, 1976; Rozeff, 1982; Easterbrook, 1984).
Firstly, Jensen and Meckling (1976) suggest that managers tend to invest free cash flows, which should have been distributed to shareholders as dividends in unprofitable (negative NPV’) projects, thereby creating an agency problem which may lead to high costs. He further argued that in order to reduce the high costs associated with agency, firms pay cash dividends to shareholders instead of investing it in negative NPV projects. Secondly, Easterbrook (1984) asserted that higher dividend payouts reduced retained earnings available, which could force managers to borrow from the capital market in order to raise funds for its investments. Furthermore, he suggested that cash dividend payments limited the possibility of investment in sub-optimal projects, increased monitoring as managers sought external financing in the capital market, and finally, ensured that they acted in the best interests of the shareholders (Easterbrook, 1984).
Lastly, Rozeff (1982), Crutchley and Hansen (1989), and Chen and Dhiensiri (2009) argue that corporate ownership, leverage, size, and agency problems affect firm dividend policies. In other words, firms with lower (higher) levels of insider ownership may have higher (lower) dividend payout ratios. For example, an increase in insider ownership reduces agency costs, because whatever affects shareholders will also affect their equity ownership in the firm. Therefore, most agency theories found consistent evidence that ‘dividend policy controls agency cost by reducing funds available for unnecessary and unprofitable investments, requiring managers to look for financing in capital markets which increases the monitoring’ (Kilincarslan, 2015 p.73).
2.2.7 Other Theories of Dividend Payment
The catering theory of dividend payments, which was developed by Baker and Wurgler (2004a) as an alternative to Miller and Modigliani’s (1961) dividend irrelevance theory, suggests that firm pays dividends as a result of investors’ preference for current cash in order to meet their consumption needs rather than future cash. The maturity hypothesis developed by Grullon et al. (2002) argued that a firm’s dividend payout ratios are based on their life-cycle rather than free cash flows as suggested by Jensen and Meckling (1986), and finally, residual dividend theory argued that firms should only pay dividends when the demand for cash for projects with a positive net present values had been met. 2.2.8 Empirical studies on Dividend Policy Conducted in Developed Countries The determinants of dividend policy have been widely investigated in the developed economies (see for example, Bradley et al., 1998; Aivazian et al., 2003; Mayers and Frank, 2004). Most of the previous studies conducted in this context have been based on testing the theoretical predictions of dividend policy by relaxing either one or more of its assumptions. Some of these studies have focused on the ownership structure (e.g. Jensen et al., 1992; Aivazian et al., 2003; Gugler, 2003; Elston et al., 2004; Bradford et al., 2013); other on agency costs (Rozeff, 1982; Crutchley and Hansen, 1989; and Chen and Dhiensiri, 2009); institutional environment (Booth and Zhou, 2017; Baker and Wurgler, 2004a; Grutton, Kanatas, and Weston, 2010); local culture (Pantzali and Ucar, 2014; Zheng, Ashraf, and Badar, 2014; Ucer, 2016); corporate governance (La Porta et al., 2000; Chan and Cheung, 2011; Chen et al., 2015; Oliveira and Jorge, 2016), and investors dividend clienteles (Becker et al., 2011; Graham and Kumar, 2006).
This review focused only on firm-level determinants relevant to this study, as there is a vast literature on dividend policies. One of the main determinants of dividend payouts, according to the literature is profitability. Empirical studies in developed countries have found a positive correlation between the dividend payout ratio and profitability (DeAngelo et al., 1992; Fama and French, 2001; Aivazian et al., 2001). It is argued that the more profitable a firm is, the more likely they are to pay a dividend (Aivazian et al., 2001). Fama and French (2001) argued that firms with higher profitability and low-growth opportunities tend to have a higher dividend payout ratio because of free cash flow. Similarly, Denis and Osobov (2008) found that a higher dividend payout ratio is associated with higher profitability, as a result of a higher retention ratio. Also, both Amarjit et al. (2010) and Gill et al. (2010) share the view of Denis and Osobov (2008) that profitability and dividend payout ratios are positively correlated, in their study of the determinants of dividend policy of American service and manufacturing companies.
Another determinant of firm dividend payouts is size. Empirical evidence from the literature argues that large firms have access to external funds in the capital markets with fewer restrictions compared to small firms, and as a consequence, may pay high dividends (Jensen et al., 1992; Redding, 1997; Holder et al., 1998; Fama and French, 2000; Manos, 2002; Travlos et al., 2002). For instance, Holder et al. (1998) found a positive correlation between dividend payout ratio and firm size. They argued that larger firms have access to the capital markets, follow stricter mandatory disclosure requirements, are followed by financial analysts, and have a higher dividend payout ratio. Forace (2003) examined the dividend policy of Australian and Japanese listed firms, and also found size to be positively correlated with dividend payouts. However, Smith and Watts (1992) found no correlation between the dividend payout ratio and firm size. Current earnings and past earnings have been documented as another factor influencing dividend payouts. Benarti et al. (1997) examined the determinants of dividend payouts using a sample of 1025 firms listed on the New York Stock Exchange (NYSE) for a period of 13 years from 1979-1991. They found a positive correlation between the dividend payout ratio and current earnings. According to Fama and Babiak (1968) the level of expected earnings influences dividend payouts, as firms are reluctant to increase dividends only when earnings is certain. Other studies have also found a positive correlation between earnings and the dividend payout ratio (Bradley et al., 1998; Mayers and Frank, 2004; Pappadopoulos and Dimitrio, 2007). However, Fama and Gaver (1993) examined the determinants of payouts using a sample of US firms; and found a negative correlation between the dividend payout ratio and growth opportunities. Similarly, Fama and French (2000) and Grullon et al (2002) found consistent results that the dividend payout ratio and growth are negatively correlated. They argued that mature firms have less investment, larger free cash flows, and are more likely to pay dividends compared to growing firms with larger growth opportunities. In contrast, Abreu (2006) found a positive correlation between the target dividend payout ratio and growth opportunities as measured by growth in sales.
Another determinant of payouts as evidenced in the literature is debt. Prior studies (e.g., Rozeff, 1982; Aivazian et al., 2003b; DeAngelo and DeAngelo, 2007), have all investigated the determinants of dividend policy using debt as one of the proxies in their models. Some scholars have argued that agency costs associated with free cash flow problems may be mitigated through issuing debt or paying cash dividends to shareholders (Jensen and Meckling, 1979; Jensen, 1986; Crutchley and Hansen, 1989). They argued further that debt and dividends may serve as alternative measures in controlling agency problems; therefore, the two are inversely correlated. In addition, Rozeff (1982) suggests that the dividend payout ratio and debt are inversely correlated. He argued that high fixed interest obligations arising from the use of debt financing will reduce profit after tax, and consequently, reduce the dividend payout ratio. Aivazian et al (2003b) examined the determinants of dividend policy with a comparative analysis of developed and developing markets. They used the debt ratio as one of the proxies of dividend determinants and found a negative correlation between debt and the dividend payout ratio, consistent with results found in the developed markets. In addition, prior studies (e.g. Darling, 1957; Jensen, 1986; Manos, 2002; Kisman, 2013) have suggested that liquidity helps in maintaining sound financial manoeuvring and also influences dividend policy decisions of firms because the shorter the conversion of its stock to cash, the more likely that cash dividends will be paid to shareholders. Similarly, Manos (2002) and Ho (2003) agreed that higher dividend payouts are positively correlated with higher liquidity because firms that are liquid are better placed to pay cash dividends as no external borrowing is required which might otherwise increase interest payments, compared to illiquid firms. In support of Ho (2003), Gupta and Parua (2012) argued that higher liquidity shows that the firm is sound and capable of meeting its financial obligations. However, a few studies have documented a negative relationship between liquidity and the dividend payout ratio by suggesting that liquidity has no informational effect on the dividend payout ratio (Mehta, 2012; Al-Najjar, 2009).
Asset tangibility has also been investigated as another determinant of dividend payouts (e.g., Jensen and Meckling, 1986; Rajan and Zingales, 1995; Booth et al., 2001). For instance, Jensen and Meckling (1986) argued that managers can use non-current assets (fixed assets) to raise additional debt in order to increase monitoring by the debt holders. In support of agency theory, Aivazian, Booth, and Clearly (2003) suggest that firms with more tangible assets in relation to total assets have lower dividend payouts compared to firms with less tangible assets, in a market where short-term debt is the major source of funding. They went on to argue that, more tangible assets allow firms to borrow more to control agency costs rather than relying on dividends to mitigate agency problems.
2.2.9 Empirical Literature
on the Determinants of Firm Dividend Policies in Developing Countries Developing countries are different from their developed counterparts in terms of regulatory framework, environment, laws, corruption, and disclosures (La Porta et al., 1999, 2000; Aivazian et al., 2003a, 2003b). Accordingly, emerging markets may provide insight into corporate dividend behaviour, in the context of their weak institutional environment (Adaoglu, 2000). The following sections review key empirical studies on determinants of dividend policy in emerging markets. Several studies have been conducted to provide empirical evidence on the determinants of firms’ dividend payout ratios from an emerging market perspective.
One explanation is based on earnings (e.g. Glen et al., 1995; Adaoglu, 2000; Aivazian, 2003). Glen et al. (1995) studied the dividend payout policy of firms in both developed and emerging markets. They found that the dividend payout behaviour of firms in developed countries differs from their developing counterparts because of volatility in earnings. Similarly, Adaoglu (2000) shares the same view as Glen et al. (1995) in a study conducted on listed firms in the Istanbul Stock Exchange, arguing that there is a positive relationship between the dividend payout ratio and earnings. Meanwhile, Aivazian et al. (2003b) examined the determinants of dividend policy in eight emerging markets. They found that the firm-level determinants affecting the payout ratios of US firms also affected the payout ratios of companies from these eight countries. In particular, the results reveal that profitability, size, business risk and the market-to-book ratio are positively correlated with the dividend payout ratio, while the debt ratio and the dividend payout ratio are negatively correlated for both developed and developing markets. The basis of their argument was that developing countries have unstable financial systems, which make dividends less stable when compared to their developed counterparts with stable financial systems. Dividends become uncertain as they are based on earnings. They are less important in predicting future earnings for emerging markets. Al-Najjar (2009) examined the determinants of dividend payouts of 86 non-financial firms listed on the Jordanian Exchange over a period of 10 years from 1994 to 2003. The results indicate that dividend payouts are positively correlated to profitability, growth opportunities, and firm size, and are negatively correlated to the debt ratio, asset tangibility and business risk. Mehta (2012) investigated the determinants of dividend payout decisions in 44 non-financial firms in the United Arab Emirates (UAE) over five years from 2005 to 2009. The study employed multiple regression analysis and the results revealed a negative correlation between dividend payouts and firm size, while a positive relationship was found between profitability, liquidity and leverage. Other reviews are presented in the summary table in Appendix 3.
2.2.10 Dividends and the Industry Effect
Literature suggests that the industry effect is one of the major reasons behind variations in dividend payouts (Ozo, 2014). For example, Lintner (1956) observes that mature firms are more likely to pay dividends than growth firms, due to their maturity. He maintains that most mature firms are stable, and can afford to pay higher dividends than the growth (newly established) firms. In addition, some studies have examined the correlation between the dividend payout ratio and industry dummies, but their findings have been inconclusive. For example, Baker et al., 2001; Baker et al., 2008; Baker and Powell, 1999) found a positive correlation between the dividend payout ratio and industry effect. In particular, Baker et al. (2000) surveyed NYSE listed companies to ascertain the managers’ views on the determinants of dividend policy. They found that high payouts were associated with the utilities, whereas manufacturing and retail sectors have moderate to low dividend payouts because of the highly liquid nature of their business, suggesting a variation in payouts among industries. Furthermore, they conclude that, investors’ desire for current income over future income influences firms’ dividend payout decisions. Similarly, Baker et al. (2008) examined the perception of managers of financial and non-financial institutions in Canada on the dividend payout ratio and industry effect, and also found a positive correlation. However, he claimed that the industry effect has diminished compared to previous findings, as earnings are the main determinant of dividend payouts over time. Therefore, empirical evidence from the literature in corporate finance supports the industry effect, showing that dividend payout is positively correlated. Therefore, we expect industry dummies to influence the dividend payouts of Nigerian listed firms, due to the uniqueness of each industry and its shareholders.
2.2.11 Dividend Payments in Nigeria
This section discusses dividend payments in Nigeria. Usually, dividends can either be paid by cash, shares or share buybacks (Arnold, 2008). Nigeria’s financial system did not allow for share buyback until a recent amendment within the Companies and Allied Matters Act 2004, which empowers firms to buy back its shares under stringent conditions and specifies the categories of people whom they can buy from, in order to protect the debt holders and avoid dilution of the company’s capital. Accordingly, Section 187 of this Act provides for the payment of the share buyback from the distributable profits of the firm. Also, Section 380 of the Act stipulates that firms can pay dividends from their revenue reserves, profits arising from the sale of its fixed assets or profits arising from the use of its properties. It also states that directors of the company may pay dividends either in the form of cash or bonus issues as they deem fit. The Act did not mandate companies to pay dividends, as seen in most developed countries; instead, they are allowed to decide when to pay and only if they would not wound-up after payment of cash dividends (see Companies and Allied Matters Act, as amended 2004).
The researcher seeks to examine the determinants of dividend payouts on Nigeria listed companies and to consider the implications when compared with prior empirical evidence documented in developed markets.
2.2.12 Institutional Environment in Nigeria
Nigeria has witnessed many reforms, from Structural Adjustment Programme (SAP) introduced in 1986 during military regime to the National Economic Empowerment and Development Strategy introduced by the civilian government in 2003. One of the major economic reforms (Banks Consolidation) by Olusegun Obasanjo in 2004 was geared towards strengthening the financial sector, as a result of the interest rate ceiling imposed by the Structural Adjustment Programme, in order to improve the availability of credit. These economic reforms liberated the financial sector from the real negative interest rates imposed by the SAP in the past by ensuring that a minimum capital base of ^25billion was maintained by banks in Nigeria, thereby enhancing the liquidity of the financial sector. Also, the economic reforms brought about the deregulation of markets, an increase in GDP growth to 1.94% in 2019, lowering of taxes and a rise in foreign direct investment.
Following the enactment of the Investment and Securities Act in 2007 by the Securities and Exchange Commission (SEC), there has been a massive improvement in the market as a result of scrutiny and supervision of the Nigerian Stock Market by the SEC. As a consequence, firms can now raise funds through the capital markets rather than depending on the retention of profits for investment purposes which may influence their dividend payout. Another peculiar feature of the stock market concerns the issue of shareholding. In Nigeria, most of the company’s shares are placed in the hands of institutional investors who are mostly financial institutions, which reduces the stock float and increases the propensity of firms to pay cash dividends.
Corruption affects most countries globally (Ojeka et al., 2019). The effect of corrupt practices on the business environment has generated considerable debate among scholars. Some have argued that a weak legal system, which is seen in most corrupt countries, fails to protect the interests of shareholders and thereby discourages cash dividend payments (La Porta, 2000). Others view it as a more of a corporate governance problem (Xia and Fang, 2005). Recent studies have shown that the institutional environment determines corporate behaviour and dividend payouts. For instance, Faccio et al. (2001) and Brockman and Unlu (2009) share the view that high dividend payouts by listed firms in the common-law countries, signify strong investor protection. However, this cannot be said of Nigeria, despite her being one of the common-law countries.
Since independence in 1960, Nigeria’s economic environment has been marred by corruption, not only among public officers, but also across policy makers in various institutions (Ojeka et al., 2019). According to Transparency International in 2019, Nigeria ranked 146 out of 180 most corrupt countries in the world, as evidenced by a corruption perceptions index score of 26/100, which shows the prevalence of corrupt practices in the Nigerian environment. However, there are few empirical studies that examine the influence of corruption on firms’ dividend payouts in the Nigerian context, despite substantial evidence from other countries (Kalcheva and Lins, 2007). Yaroson (2013) studied the effect of corruption in financial sectors, which led to bank failures in Nigeria after the merger of banks in 2004, using World Bank institutional quality indices such as political instability, rule of law, regulatory quality, control of corruption index, government effectiveness, voice and accountability, and found that bank failures could be linked to corruption in the institutional environment. Similarly, Ojeka et al. (2019) studied the impact of perceived corruption, institutional quality and performance on Nigerian listed firms. They found that corruption was more common in the non-financial sector than the financial sector in Nigeria, due to less strict regulation. They also found that the financial sector was more leveraged compared to the non-financial sector, increasing the risk appetite of the board to maximise owners’ economic wealth through high dividend payouts. In other words, the excessive risk appetite of financial institutions in Nigeria, may have led to stricter regulation within the environment (Haan and Vlahu, 2012). In conclusion, the institutional environment may be vital in examining the determinants of dividend payouts of firms in Nigeria, as suggested by prior studies (Ojeka et al., 2019; Yaroson, 2013). Also, it is expected that dividend payouts of firms listed on the Nigerian Stock Exchange may be different to other developing countries, as a result of a weak regulatory environment, widespread corruption, a weak legal system, weak corporate governance and a low retention ratio.
2.2.13 Prior Dividend Studies in Nigeria
This section reviews the empirical studies on determinants of dividend policy conducted in Nigeria in order to identify the gaps in the existing literature. It is important to note that prior Nigerian studies on the determinants of dividend policy have used small samples, only covering a few industries such as oil and gas, and consumer goods, and their findings were either contradictory or inconclusive.
A number of studies have examined the determinants of payout ratios of Nigerian listed firms using methods similar to those of research conducted in developed countries (Lintner, 1956; Friend and Puckett, 1964; Miller and Scholes, 1974; and Baskin, 1989). For instance, Uzoaga and Alozieuwa (1974) studied the pattern of dividend policy employed by Nigerian firms during the period of indigenisation and the participation programme in 1973. The study used a sample comprising 13 firms listed on the Nigerian Stock Exchange (NSE) over a period of four years. There was insufficient evidence to validate the ‘classical influences’ that determine dividend policies in Nigeria during that period. However, they concluded that ‘fear and resentment’ seem to have taken over from the classic forces. In addition, Soyode (1975) challenged the findings of Uzoaga and Alozieuwa (1974) on the grounds that they excluded certain relevant factors that determine the optimal dividend policy of a firm, such as earnings, size, and free cash flows.
Oyejide (1976) extended the previous work by Uzoaga and Alozieuwa (1974) and Soyode (1975) by testing dividend policy in Nigeria using Lintner’s model as modified in Brittain (1964). The findings of the study showed that dividend payouts of Nigerian firms can be explained by conventional factors such as the target payout ratio, leverage, growth, and profitability. Odife (1977), in attempt to discover the rationale behind the dividend policy pattern of Nigerian firms, studied dividend policy in the era of indigenisation in Nigeria, and found a strong evidence to disagree with Oyejide (1976), for failing to adjust for stock dividends. Izedonmi and Eriki (1996) carried out a study on the dividend policy of Nigerian firms using Lintner’s model and found consistent evidence that target and future payout ratios influence firms’ dividend policy, thus supporting Oyejide (1976). In a similar manner, Adelegan (2003) examined the incremental information content of cash flows in explaining dividend changes and earnings in Nigeria. The study focused on 63 firms quoted on the Nigerian Stock Exchange from 1984-1997, and found results consistent with Oyejide (1976). Furthermore, Fodio (2009), Adelegan (2009), Adefila, Oladapo, and Adeola (2013), Oyinlola and Ajeigbe (2014), Duke, Ikenna and Nkamare (2015), and Egbeonu, Paul-Ekwere and Ubani (2016) carried out similar studies on the determinants of dividend policy of financial firms in Nigeria and found a positive correlation between dividend payout and firm-level factors (e.g., earnings, liquidity and size). Recent studies by Uwuigbe (2013) and Dada and Malomo (2015) found dividend payouts of Nigerian banks to be correlated with size, leverage, and board independence, while Edet et al (2014) found a negative correlation between dividend payout and liquidity. The rest of the studies can be found in Appendix 3. In conclusion, the review shows that prior studies in Nigeria were mostly on the financial sector due to its strict regulatory framework and the availability of data (Edet, Atairet and Anoka, 2014). In other words, it may be due to the different techniques, time-variation and small sample size. Some studies have found profitability, liquidity, and size to be negatively correlated the dividend payout ratios of financial institutions (Saeed et al., 2013; Edet, Atairet and Anoka, 2014). However, there is also evidence from literature that suggests that profitability, liquidity and size are positively correlated to dividend payout ratios (Fama and French, 2001; Manos 2002). This current study attempts to fill a gap in the literature by examining the determinants of dividend payout ratios in the non-financial sector in Nigeria which has been neglected despite the fact that it represented 70% of Nigeria’s GDP in 2019.
3.0 RESEARCH METHODOLOGY
3.1 Introduction
This section discusses the research methodology of this current study, describing the data set/sample, and then developing the research hypotheses and discussing the statistical methods used to test these hypotheses.
3.2 Data and Sample
For the purpose of this study, accounting data of companies listed on the Nigerian Stock Exchange (NSE) was manually collected from their annual accounts, which were obtained from companies’ official websites and market data from the Nigerian Stock Exchange. The accounting data was manually collected for the following reasons. Firstly, there are no readily available electronic databases, similar to DataStream and Bloomberg, which can provide complete accounting data for Nigerian listed firms (Adelopo, 2011; Egbeonu and Edori, 2016; Ozuomba and Ezeabasili, 2017). Secondly, to the best of my knowledge, there is no official national depository for Nigerian listed firms’ annual accounts. Lastly, previous empirical studies focusing on the Nigerian market also had difficulty in collecting firms’ accounting data and had to rely on hard copies of annual accounts (Nwidosie, 2012; Nduka and Titilayo, 2018; Uwuigbe, Jafaru and Ajayi, 2012). A company needs to meet the following criteria in order to be included in the final sample. Firstly, it must be quoted on the Nigeria Stock Exchange as at 1st January 2013, and its annual accounts for the period between 1st January 2013 and 31st December 2017 must be available on their official websites. Secondly, it has paid cash dividends from 1st January 2013 to 31st December 2017. Thirdly, all the financial firms comprising commercial banks, insurance companies, finance houses, primary mortgage institutions, community banks, discount houses, and bureaus de change are excluded because of their stricter regulations, dividend and investment policies. After using all the criteria listed above, the final sample consists of 74 companies divided into ten sectors with 370 observations (see Table 4.1 below for the sectoral breakdown and Appendix 1).
3.3 Models and Hypotheses
• Regression Model This study aims to examine empirically the determinants of the dividend payout ratio of non-financial firms listed on the Nigerian Stock Exchange. The study has a panel dataset of 74 non-financial companies listed on the NSE over a five-year period of 2013-2017. Panel data consists of time-series and cross-sectional dimensions across time (Hill, Griffiths, and Lim, 2007). Panel data estimates are more reliable as they reduce bias due to aggregation (Baltagi, 2001). Panel data can be balanced or unbalanced, short or long panel (Stock and Watson, 2003; Baltagi, 2001). Due to missing observations, as a result of mergers and acquisitions, the study sample was limited to five years from 2013-2017, and therefore provides a balanced panel data with 370 observations over the period. This study uses pooled panel regressions in order to test the hypotheses formulated on the basis of existing literature on the firm-specific determinants of dividend payouts in Nigeria.
To test the relationship between dividend payouts and firm-level determinants, we consider the following models:
General panel data model Yit = β0 + β1X1it + β2X2it+βnXnit + εit……… (1) Where: Y = dependent variable to be estimated t = time dimension I = individual entity β0 = intercept β1, β2, and βn= coefficient of the explanatory variables X1, X2…..Xn are explanatory variables εit = error term within entity
• Model Specification for this study: DI i,t = β0 +β1ROAi,t +β2sizei,t + i,t + β4DRi,t+ β5Liqi,t+β6TANGi,t+βtYEARi,t+βjINDUSTRYjt+ ɛit…(2)
Alternatively:
DPR i,t = β0 + β1ROAi,t + β2sizei,t + β3GRT i,t + β4DRi,t + β5CURRi,t + β6TANGi,t+ βtYEARt+ βjINDUSTRYjt + ɛit…(3)
where: DI i,t denotes the dividend payout ratio for firm i in year t (i=1,….,N; t=1,…, DI) used as the dependent variable of the study; DRPit represents the alternative proxy for the dependent variable for firm I in year t (I =1,…N; t=1,…, DI i,t ); independent variables are ROAit, which measures the return on assets for firm I in year t; size of each firm (sizeit), leverage ratio (DRit), growth rates (GRTit), and liquidity ratio (CURRit) for firm i at time t; β0, β1, …, β6 are parameters to be estimated; ɛit is an idiosyncratic disturbance term.
• Definition of Variables and Development of Hypotheses The empirical model for this study is largely based on the theoretical model used by Gugler (2003) and Aivazian et al (2003). They studied the determinants of dividend policy in the emerging markets using dividend payout ratios as proxies for dividend policy. Prior studies used performance indicators such as firms’ earnings, growth rate, and level of debt, lagged price/earnings ratio and size as control variables in the model (Baskin, 1989). This study employs two proxies for the dependent variable, namely dividend intensity and the dividend payout ratio. The latter was used as an alternative proxy for the dependent variable. The variables for this research are defined below.
• Dependent Variable (Dividend Intensity) Dividend intensity is used as the main proxy for the dependent variable in this study. Following previous studies (e.g. Fama and French, 2002; Aivazian et al., 2003; Kumar, 2006), this study calculates dividend intensity as the ratio of the total cash dividend paid by a firm in one year to the book value of its assets at the end of that year. The dividend payout ratio is used in this study as an alternate proxy for corporate dividend policy. It is the proportion of net earnings paid out to shareholders in the form of dividends. Following previous studies (e.g. Gugler, 2003; Aivazian et al., 2003), the dividend payout ratio is calculated as the total annual ordinary dividend paid to shareholders divided by profit after tax less the preference dividend for that year.
• Profitability (ROA) The corporate finance literature suggests that profitability plays a vital role in firms’ payout decisions (Bhattacharya, 1979; Miller and Rock, 1985). It is argued that dividends are paid out from current or past profits and therefore firms that make more profit may be inclined to pay out higher cash dividends to shareholders. In seeking empirical evidence in support of Bhattacharya’s (1979) theoretical predictions, Miller and Rock (1985), and John and Williams (1985) found a positive correlation between higher dividend payouts and profitability. Also, recent empirical studies have found that dividend payout ratios and profitability are positively correlated (Adaoglu, 2000; Aivazian et al., 2003; Al-Malkawi, 2005). Therefore, I formulate the following hypothesis regarding the relationship between dividend payout ratios and profitability: H1: Dividend payout is positively correlated to firms’ profitability.
• Firm Size The size of a firm is one of the main determinants of dividend payout decisions. In this study firm size is measured as the natural logarithm of total assets of the firm, in line with prior empirical studies (Hussainey et al., 2011). Firstly, size may serve as a proxy for information asymmetry: larger firms are perceived to have a lower degree of information asymmetry. For example, larger firms face stricter mandatory disclosure requirements, are followed by more financial analysts, and also may pay higher cash dividends. Secondly, size may act as a proxy for access to external capital markets. Larger firms face fewer constraints in accessing external funds from capital markets with lower costs than smaller firms, and they can afford to pay higher cash dividends (Gaver and Gaver, 1993). Other studies have also found a positive correlation between dividend payout ratios and size (Manos, 2002; Travlos et al., 2002; Al-Malkawi, 2005). Therefore, I formulate the following hypothesis regarding the relationship between dividend payout and firm size: H2: There is a positive relationship between firm size and dividend payout.
• Growth Opportunities Growth opportunities are measured in this study as the ratio of book value per share to market value per share (e.g. Chang and Rhee, 2003; Jaara et al., 2018). There is some evidence in the literature that growth potential and dividend payments are inversely related, as it is argued that a growing firm needs cash for investment and therefore, growth opportunities may force them to pay a low or no dividend (Gaver and Kenneth, 1993; Faccio et al., 2001; Baker and Powell, 2012). In support of Gaver and Kenneth (1993), Deshmukh (2003) and Aivazian et al. (2003) argued that dividend payout and growth opportunities are negatively correlated. They suggested that mature firms pay higher dividends because they have fewer growth opportunities, while growing firms pay lower dividends because of lower free cash flows and huge investment opportunities. In a similar vein, Smith and Watts (1992) found a negative correlation between dividend payout ratios and growth opportunities. They suggest that high dividend payout ratios are negatively correlated to growth opportunities because a high dividend payout reduces cash available for future corporate earnings growth. Therefore, I hypothesise that: H3: There is a negative relationship between dividend payout and growth opportunities.
• Debt Ratio (Leverage) Prior studies have measured the debt ratio as the ratio of total debt to total assets of the firm (Rozeff, 1982; Aivazian et al., 2003b; DeAngelo and DeAngelo, 2007). The same definition is used by this study. Some scholars have argued that agency costs associated with free cash flow problems may be mitigated through issuing debt or paying cash dividends to shareholders (Jensen and Meckling, 1979; Jensen, 1986; Crutchley and Hansen, 1989). They suggest that debt and dividends may serve as alternative measures in controlling agency problems and therefore the two are inversely correlated. In addition, Rozeff (1982) suggests that dividend payout and debt are inversely correlated. He argues that high fixed interest obligations arising from the use of debt financing reduce profit after tax, and consequently reduce dividend payout. Hence, I formulate the following hypothesis:
There is a negative relationship between debt ratio and dividend payout.
• Liquidity
In line with previous literature (e.g. Jensen, 1986; Manos, 2002), we proxy liquidity by the current ratio defined as current assets divided by current liabilities in one year (Al-Najjar, 2009; Imran, 2011; Kisman, 2013). Prior studies have suggested that liquidity helps in maintaining sound financial manoeuvring and also influences firms’ dividend policy decisions, because the shorter the conversion of its stock into cash, the more likely the firm is to pay cash dividends to shareholders (Darling, 1957). Similarly, Manos (2002) and Ho (2003) agree that higher dividend payouts are positively correlated with higher liquidity, because firms that are liquid are better placed to pay cash dividends as no external borrowing is required, which might increase interest payments compared to illiquid firms. In support of Ho (2003), Gupta and Parua (2012) argue that higher liquidity shows that the firm is sound and capable of meeting its financial obligations. However, a few studies have documented a negative relationship between liquidity and dividend payout ratio, suggesting that liquidity may have no informational effect on dividend payout ratios (Mehta 2012; Al-Najjar, 2009). Therefore, the following hypothesis is formulated: H5: There is a positive relationship between dividend payout and liquidity.
• Asset Tangibility
Tangible assets are those physical assets that can be measured in monetary terms (Pandey, 2005). Tangibility of assets is measured in this study as the ratio of fixed assets to total assets (e.g. Rajan and Zingales, 1995; Booth et al., 2001). Jensen and Meckling (1986) argued that managers can use non-current assets (fixed assets) to raise additional debt in order to increase monitoring by debt holders. In support of agency theory, Aivazian, Booth, and Clearly (2003) suggest that firms with more tangible assets in relation to total assets have lower dividend payouts compared to firms with fewer tangible assets, in a market where short-term debt is the major source of funding. For example, more tangible assets allow firms to borrow more to control the agency costs rather than relying on dividends to mitigate agency problems. Hence, I formulate the following hypothesis as: H6: There is a negative relationship between dividend payout and asset tangibility.
• Time Effect
This study employs time effects in the regression models in order to control for unobserved time variant effects due to institutional environment factors such as political instability, corruption, economic recession, and regulatory changes (Wei et al., 2011; Setia-Atmaja et al., 2009; Chen et al., 2005). Therefore, year dummies were added into the regression model to capture certain time-specific effects that cannot be captured by firm-level determinants which include the effect of macro indicators, and take a value of 1 for the specific year and 0 otherwise. The reference year 2013 was used to reflect the period in which International Financial Reporting Standards (IFRS) were adopted by companies in Nigeria.
• Industry Effect
Corporate finance literature argued the need for industrial classification, in order to detect the impact of an industry effect associated with different regulatory frameworks, growth and risk (Baker et al., 1985 and Moh’d et al., 1995). For this reason the data sample was divided into ten different sectors in Nigeria from 2013 to 2017. Hence, the industry effect is defined in line with the code assigned to each industry by the Nigeria Stock Exchange (NSE). We used the agricultural sector as the base category in the alphabetical ordering of the sectors (see below the summary table for definition of variables listed above).
Table 1: Summary Table of Variable Definitions.
| Variables | Symbol | Proxy /Measurement | Expected Outcome |
| Dependent Variable: Dividend Intensity | DIit | Total annual dividend divided by net book value of assets at the end of the year | |
| Alternative Dividend Payout Ratio | DPRit | Total annual dividend/Total annual profit after tax | |
| Independent Variables: | |||
| Profitability | ROA | ROA is calculated as profit after tax divided by capital employed of firm i at year t over the period 2013-2017. | Positive relationship |
| Firm Size | SZit | Size is measured as the natural logarithm of total assets of company i at year t over the year | Positive relationship |
| Growth Opportunities | GRTit | Growth is measured as the ratio of book value per share to market value per share in a given year. | Negative relationship |
| Debt / Leverage Ratio | DRit | Leverage is defined as yearly total debt divided by yearly total assets of firm i at year t over the period. | Negative relationship |
| Liquidity Ratio | CURRit | Current ratio is calculated as yearly total current assets divided by the yearly current liabilities of firm i at year t over the period. | Positive relationship |
| Tangibility of Assets | TANGit | Tangibility of assets is calculated as yearly fixed assets divided by yearly total assets of firm i at year t over the period. | Negative relationship |
| Time Effect | YEARt | Time effect was captured by assigning value of 1 for the specific year and 0 otherwise. By excluding year 2013 taken as the reference category. | Positive relationship |
| Industry Effect | INDUSTRYt | Industry dummies were captured by assigning value of 1 for the specific year and 0 otherwise. The reference category is Agriculture. | Positive relationship |
4.0 DISCUSSION FINDINGS
4.1 Introduction
This section presents and discusses the empirical findings. The empirical results of this paper are analysed and interpreted alongside other tests conducted in order to identify the determinants of dividend payouts of non- financial firms listed on the Nigerian Stock Exchange. The section is divided into five sections as follows: Section 4.2 presents the descriptive analysis of the study; Section 4.3 discusses the correlation matrix and the
variance inflation factor of the variables; Section 4.4 presents the empirical results from the pool regression model; and finally, Section 4.5 concludes the paper.
4.2 Descriptive Analysis
This section presents the descriptive statistics by sector from the firm-level data manually collected from companies’ annual reports and market data obtained from the Nigerian Stock Exchange (NSE). In section three above, the dividend payout ratio (DPR) and dividend intensity (DI) were identified as proxies for dependent variables in order to examine the determinants of dividend payouts of non- financial firms listed on the Nigerian Stock Exchange. Table 2 below presents the results of descriptive statistics by sector and for firms as a whole from the STATA 1C 10.0 output of 74 firms of the sample, with 370 firm year observations over the period of five years from 2013 to 2017.
| Variable | Mean | Std. Dev. | Min | Max |
| AGRICULTURAL SECTOR | ||||
| DPR | 0.4057251 | 0.1553195 | 0.1254312 | 0.7692308 |
| DI | 0.0474430 | 0.0584739 | 0.0035907 | 0.2004437 |
| ROA | 0.1757702 | 0.1102070 | 0.0469180 | 0.3550633 |
| SIZE | 7.1222200 | 0.4820221 | 6.5098270 | 7.9926600 |
| GRT | 0.0427691 | 0.0208327 | 0.0102141 | 0.0820308 |
| DR | 0.5261866 | 0.1946143 | 0.2136090 | 0.9191729 |
| CURR | 1.1171830 | 0.6501403 | 0.2162681 | 2.7827270 |
| TANG | 0.1070451 | 0.0436089 | 0.0759649 | 0.2068694 |
| OIL & GAS SECTOR | ||||
| DPR | 0.4144660 | 0.2503525 | 0.0057637 | 0.9049774 |
| DI | 0.2177075 | 0.2741841 | 0.0011398 | 0.9570153 |
| ROA | 0.1149375 | 0.1511252 | 0.0008668 | 0.8054034 |
| SIZE | 7.3420350 | 0.8528009 | 5.3019430 | 8.3030160 |
| GRT | 0.2359059 | 0.2576386 | 0.0127120 | 0.9889747 |
| DR | 0.5521249 | 0.2611337 | 0.0229338 | 0.8711427 |
| CURR | 1.4538200 | 0.6567724 | 0.6422086 | 3.6460960 |
| TANG | 0.2509074 | 0.1727264 | 0.0144998 | 0.7046812 |
| CONSUMER SECTOR | ||||
| DPR | 0.3675917 | 0.2366268 | 0.0116822 | 0.8928571 |
| DI | 0.0386686 | 0.0393105 | 0.0010572 | 0.1563715 |
| ROA | 0.1394722 | 0.1087413 | 0.0078932 | 0.5024121 |
| SIZE | 7.6704130 | 0.8528009 | 6.2404890 | 8.7317800 |
| GRT | 0.4084002 | 0.2453225 | 0.0088454 | 0.9889747 |
| DR | 0.5624149 | 0.1583591 | 0.0875500 | 0.8764213 |
| CURR | 1.115728 | 0.578707 | 0.2700000 | 2.8808130 |
| TANG | 0.2131336 | 0.1703591 | 0.0500251 | 0.6240171 |
| CONGLOMERATES SECTOR | ||||
| DPR | 0.4463600 | 0.2489957 | 0.0144578 | 0.7777778 |
| DI | 0.1170832 | 0.1341857 | 0.0107652 | 0.4478598 |
| ROA | 0.0546222 | 0.0948561 | 0.0103471 | 0.4478598 |
| SIZE | 7.4094900 | 0.2323234 | 7.0889850 | 7.8000480 |
| GRT | 0.4620900 | 0.3773528 | 0.0553251 | 1.5228430 |
| DR | 0.4508720 | 0.1709708 | 0.1830380 | 0.7434763 |
| CURR | 1.4171460 | 0.4649180 | 0.6318092 | 2.1214910 |
| TANG | 0.1624765 | 0.1631522 | 0.0510545 | 0.4775122 |
| SERVICES SECTOR | ||||
| DPR | 0.2751441 | 0.2716171 | 0.0062069 | 0.9532415 |
| DI | 0.0564917 | 0.1042456 | 0.0022712 | 0.7131184 |
| ROA | 0.0938340 | 0.0752627 | 0.0046647 | 0.3259819 |
| SIZE | 6.6900430 | 0.5286340 | 5.7387350 | 7.8000480 |
| GRT | 0.4781347 | 0.3802537 | 0.0310398 | 1.9954130 |
| DR | 0.3974246 | 0.1662542 | 0.1045851 | 0.6712983 |
| CURR | 1.5369530 | 1.0087470 | 0.1862702 | 4.0054330 |
| TANG | 0.2144720 | 0.1699407 | 0.0540982 | 0.5928596 |
| HEALTH SECTOR | ||||
| DPR | 0.3734954 | 0.2798142 | 0.0150000 | 0.9756098 |
| DI | 0.0169522 | 0.0124279 | 0.0029433 | 0.0436674 |
| ROA | 0.1026479 | 0.1040387 | 0.0068419 | 0.3792053 |
| SIZE | 7.6389220 | 1.2852390 | 6.3424710 | 9.7843460 |
| GRT | 0.3311236 | 0.2582356 | 0.0652907 | 1.3626130 |
| DR | 0.3705172 | 0.2011195 | 0.0015460 | 0.6464701 |
| CURR | 1.3520220 | 1.0911180 | 1.00e-0500 | 4.6588170 |
| TANG | 0.2218262 | 0.1896474 | 0.0704623 | 0.6104171 |
| ICT SECTOR | ||||
| DPR | 0.2464602 | 0.1198595 | 0.1005263 | 0.4285714 |
| DI | 0.0218557 | 0.0187288 | 0.0033127 | 0.0627198 |
| ROA | 0.1356867 | 0.1638984 | 0.0065873 | 0.5516571 |
| SIZE | 6.6383770 | 0.2675502 | 6.2225430 | 7.1323510 |
| GRT | 0.3434042 | 0.2347694 | 0.0870189 | 0.9816628 |
| DR | 0.3638805 | 0.0879806 | 0.2034012 | 0.5689399 |
| CURR | 1.5594420 | 0.5381541 | 0.3892068 | 2.3679060 |
| TANG | 0.5151028 | 0.2400591 | 0.0694111 | 0.7954507 |
| NATURAL RESOURCES SECTOR | ||||
| DPR | 0.1852596 | 0.0604766 | 0.0892857 | 0.2777778 |
| DI | 0.0063923 | 0.0020840 | 0.0036789 | 0.0098891 |
| ROA | 0.0771797 | 0.0353063 | 0.0299243 | 0.1287777 |
| SIZE | 6.4128960 | 0.1439176 | 6.2266240 | 6.6282420 |
| GRT | 0.5836584 | 0.2309313 | 0.2873576 | 0.9328851 |
| DR | 0.3725376 | 0.0473879 | 0.2933195 | 0.4369412 |
| CURR | 1.2738310 | 0.2679538 | 0.8686523 | 1.8761580 |
| TANG | 0.6690820 | 0.0997384 | 0.4913928 | 0.7694474 |
| CONSTRUCTION/REAL ESTATE SECTOR | ||||
| DPR | 0.3382617 | 0.3274494 | 0.0423729 | 0.8899965 |
| DI | 0.2134097 | 0.2922604 | 0.0033908 | 0.9700027 |
| ROA | 0.2324776 | 0.5574983 | 0.0035256 | 2.2373410 |
| SIZE | 7.2830270 | 0.6570266 | 6.3982400 | 8.2116290 |
| GRT | 0.6356690 | 0.9996036 | 0.1315182 | 4.1218520 |
| DR | 0.2576308 | 0.1837154 | 0.0410097 | 0.4869092 |
| CURR | 1.6190580 | 1.0339120 | 0.5344854 | 3.8137540 |
| TANG | 0.1624199 | 0.1347204 | 0.0623222 | 0.4921083 |
| INDUSTRIAL GOODS SECTOR | ||||
| DPR | 0.2944700 | 0.2457444 | 0.0068976 | 0.9788567 |
| DI | 0.0739192 | 0.1374551 | 0.0043249 | 0.6554396 |
| ROA | 0.1838749 | 0.1748810 | 0.0056364 | 0.7082495 |
| SIZE | 6.7136940 | 0.8066529 | 5.4534480 | 8.7897010 |
| GRT | 0.4173823 | 0.2379774 | 0.0635160 | 0.9623307 |
| DR | 0.3893811 | 0.1648846 | 0.0005940 | 0.8397808 |
| CURR | 1.2035320 | 0.7960778 | 0.1329550 | 3.2381590 |
| TANG | 0.2893290 | 0.1973055 | 0.0305464 | 0.7043981 |
| OVERALL SAMPLE | ||||
| DPR | 0.3422780 | 0.2494796 | 0.0057637 | "0.9788567 |
| " | 370 | |||
| DI | 0.0789549 | 0.1543807 | 0.0010572 | 0.9700027 |
| ROA | 0.1311308 | 0.1675998 | 0.0008668 | 2.2373410 |
| SIZE | 7.1726510 | 0.8369872 | 5.3019430 | 9.7843460 |
| GRT | 0.3839990 | 0.3533219 | 0.0088454 | 4.1218520 |
| DR | 0.4541883 | 0.2009096 | 0.0005940 | 0.9191729 |
| CURR | 1.3301610 | 0.7874146 | 1.00e-05 | 4.6588170 |
| TANG | 0.2487207 | 0.2019657 | 0.0144998 | 0.7954507 |
From the summary table above, dividend intensity which is the main proxy for dividend payouts has a mean average of 7% approximately, indicating that on average, sampled firms pay annual cash dividends equivalent to 7% of their total asset value. However, when sectoral comparisons were made on the basis of the main proxy (dividend intensity), we found that both oil and gas and construction and real estate sectors paid an average mean of 21% of their respective total asset value as cash dividends to shareholders, more than any other sector, whereas the health and natural resources sectors distribute an average of 2% and 1% respectively of total assets as cash dividends which was the lowest across all the sectors. The average mean dividend payout ratio (alternative proxy) for all non-financial sampled firms in Nigeria was approximately 34%, indicating that on average, 74 sampled firms paid 34% of their net profit as dividends to ordinary shareholders while the remaining observations (i.e. 66%) did not pay dividends over the five year period covered.
The return on assets (ROA) has a mean of 13%, indicating that 74 sampled firms on average earn net profit equal to 13% of their total asset value over the five year period considered. The leverage ratio has a mean of 45%, revealing that sampled firms on average have total debt equivalent to 45% of their total asset value. Also, the average growth opportunities for the period are 38%, which indicates that on average the market value of the 74 sampled firms’ shares is only around 38% of their asset value, signifying poor growth. This may be due to the economic recession experienced in Nigeria between years 2016 to 2017. Finally, liquidity (current ratio) has a mean average of 1.33, suggesting that most sampled firms in Nigeria are liquid and meet maturity obligations as and when due, while tangibility has a mean of 0.25, which reveals that about 25% of sampled firms’ assets are fixed.
When compared with other similar studies in Nigeria, the results are not significantly different. For example, Edet et al. (2014) reported a mean dividend payout ratio of 31% with a sample of 13 firms, while Zayol et al. (2017) reported a mean dividend payout ratio of 62.24%, suggesting that most Nigerian firms retain a greater portion of their earnings for financing growth opportunities. Also, the results of Zayol et al. (2017) reveal that most firms in Nigeria earn on average 16% on their total assets and maintain a liquidity ratio of 1.22 over the period covered, which is similar to the current results. Looking at those studies, the results of Edet et al. (2014) differ from those of the current research, but are to some extent consistent with Zayol et al. (2014) despite having been conducted at different times with fewer selected firms, which may have impacted on their results. Other results can be seen in the summary table above.
4.3 Correlation Analysis
Table 3: presents the correlation matrix and the Variance Inflation Factors (VIF) of the dependent variables.
From the summary correlation matrix above, it can be seen that most of the variables are not highly correlated. Therefore, a variance inflation factor (VIF) was used for further analysis to identify any multicollinearity between the independent variables. As a conventional rule, if VIF values of each independent variable exceed ten or the tolerance (1/VIF) is smaller than 0.10, it signals the presence of multicollinearity in the variable. Therefore, as shown in the summary table above, no multicollinearity exists in the dataset, since all the independent variables have both VIF and 1/VIF below the thresholds of 10 and 0.10 respectively. The next section discusses the empirical results conducted based on a pooled OLS estimator.
4.4 Empirical Results
The empirical results from winsorised data using pooled OLS with time and industry dummies are presented in Table 4 below. In order to control for time and industry classification effects on the
determinants of dividend payout of non-financial firms in Nigeria, four binary variables (e.g., 1 for specific year and 0 for otherwise) and another nine binary variables were also added to the models to account for both year and industry classification effects, while I winsorised the data in further analysis to authenticate/support the primary findings. Consequently, pooled OLS was repeated based on the winsorised panel dataset at 1% and 99% to check for any potential outliers, as empirical evidence from the literature suggests that ‘trimming or truncating’ may lead to loss of important observations (e.g. Dixon, 1960). Industry fixed effects were also performed, but the results were not significant due to limited observations (370 and 70 dummies) included over the period which shrank the degree of freedom. The results from both winsorised and unwinsorised data are similar in terms of the signs of the coefficients and statistical significance. However, the models are better fitted with the winsorised data (illustrated by adj-R squared). Therefore, the F-test of overall significance of winsorised model 1 and 2 are 0.34 and 0.10 respectively, which shows that about 34% (10%) of the variation in the dividend payout of non-financial firms in Nigeria is
explained by all the explanatory variables in the model, while 66% (90%) is not explained by the models. The results for Model 1 and Model 2 are presented below. From Table 4 below, Model 1
and Model 2 are statistically significant with F-test ratios of 0.000 and 0.019 respectively. However, Model 1 is better fitted than Model 2 as shown in the table. Hence we report our findings.
Profitability (ROA)
The results from both Model 1 and Model 2 indicate that profitability is positively correlated to the dividend payout. However, only the result from Model 1 is statistically significant at 10% level. From the summary table above, the coefficient of beta is 0.14, which means that when all other variables in Model 1 are held constant, a 1% increase in ROA will bring about a 14% increase in the dividend payout of non-financial firms in Nigeria. In addition, the economic significance of both regressions is moderate. The results provide some support to the notion that dividends are paid out from current or past profits; that is, firms that make more profit may be inclined to pay out higher
dividends to shareholders. These results are consistent with empirical studies in developed countries (e.g., Jensen et al., 1992; DeAngelo et al., 1992; Fama and French, 2000) and developing countries (Adaoglu, 2000; Aivazian et al., 2003; Al-Malkawi, 2005) that found a positive correlation between higher dividend payout ratios and profitability. Therefore, this supports the signalling theory of dividends (Bhattacharya, 1979; Miller and Rock, 1985; John and Williams, 1985) and is also consistent with similar studies in Nigeria (Zayol and Muolozie, 2017; Uwuigbe, 2013).
Size
The results from both Model 1 and Model 2 show that firm size is negatively correlated to dividend payouts, although only the result from Model 1 is statistically significant at 5% level. Also, the economic significance of both regression coefficients is low. For example, the coefficient of beta is -0.02, which implies that holding other variables constant, a ^1 decrease in size, will bring about a corresponding decrease in dividend payouts of non-financial firms in Nigeria by 2%. The results provide some support to the notion that firm size might be a proxy for the degree of information asymmetry. Larger firms tend to have lower degrees of information asymmetry than smaller firms and they do not need to use high dividend pay outs to signal their quality. However, the results do not support the notion that larger firms pay more dividends because they have better access to external financing and therefore do not need to retain a high proportion of their earnings for future investment. Therefore, my results are similar to those found by Manos (2002), Travlos et al. (2002) and Al-Malkawi (2005), although Aivazian et al. (2003) found little evidence that firm size affects dividend payout policy.
Growth Opportunities
The results from Model 1 and Model 2 found growth opportunities to be positively correlated with dividend payouts. However, only the result from Model 1 is significant at 1% level. Thus, the beta coefficient of Model 1 is 0.08, which indicates that when all other variables are held constant, a 1% increase in growth will bring about an 8% increase in the dividend payout of non-financial firms in Nigeria. The results from this study are inconsistent with empirical evidence from literature which suggests that growth potential and dividend payments are inversely related, because growing firms need cash for investment and so pay low or even no dividends (Gaver and Kenneth, 1993; Faccio et al., 2001; Baker and Powell, 2012). Smith and Watts (1992) also found a negative correlation between dividend payout ratios and growth opportunities. They suggest that high dividend payout ratios are negatively correlated to growth opportunities because, they reduce the cash available for future earnings growth from the company. Therefore, they do not support the transaction costs theory (Rozeff, 1982; Moh’d et al., 1995). The inconsistency in results may be due to Nigeria’s unique environment, dominated by small and medium sized firms who may use high dividend payouts to encourage people to invest in them.
Debt Ratio
The debt ratio hypothesis (4) a negative relationship between the debt ratio and dividend payout. Our results from Models 1 and 2 are both statistically significant at 1% and 5% levels. From the regression results, the beta coefficients are -0.219 and -0.217 respectively, which suggests that when all other variables are maintained constant, a ^1 increase in the use of debt, will decrease the dividend payout of non-financial firms in Nigeria by approximately 22%. The findings indicate a significant negative correlation between the debt ratio and dividend policy and are therefore consistent with the literature that argues that agency costs associated with free cash flow problems may be mitigated through issuing debt or paying cash dividends to shareholders (Jensen and Meckling, 1979; Jensen, 1986; Crutchley and Hansen, 1989). It was argued further that debt and dividends may serve as alternative measures in controlling agency problems and therefore the two are inversely correlated. Rozeff (1982) suggested that the dividend payout ratio and debt are inversely correlated, arguing that high fixed interest obligations arising from the use of debt financing reduce profit after tax, and consequently, reduce the dividend payout ratio. The result is also consistent with similar studies in Nigeria by Dada and Malomo (2015), Zayol and Muolozie (2017) Uwuigbe (2013) that found a negative correlation between dividend payouts and leverage.
Liquidity (Current Ratio)
Liquidity was predicted to have a positive relationship to dividend payouts. Our findings reveal that the liquidity proxy to current ratio and dividend payout ratio are positively correlated with a beta coefficient of 0.008, though not significant. Empirical evidence from the literature argued that dividend payouts are positively correlated with higher liquidity. This is because firms that are liquid are better placed to pay cash dividends as no external borrowing is required which might increase interest payments compared to illiquid firms (Manos, 2002; Ho, 2003). Similarly, Gupta and Parua (2012) argued that higher liquidity shows that the firm is sound and capable of meeting its financial obligations. However, a few studies have documented a negative relationship between liquidity and dividend payout ratio, and suggest that liquidity has no informational effect on the dividend payout ratio (Mehta, 2012; Al-Najjar, 2009). My results share the view of previous studies that liquidity has no significant effect on dividend payouts in developing countries (Al-Najjar, 2009; Mehta, 2012; Kisman, 2013).
Asset Tangibility
Asset tangibility was predicted to have a negative correlation with the dividend payout ratio. My results from both Model 1 and Model 2 as shown in Table 5.3 are negative and significant at both 5% and 10% levels respectively. For example, the beta coefficients of -0.101 and -0.157 show that, when all other variables in the models are held constant, a ^1 increase in fixed assets compared to other assets, would bring about 10% and 16% decreases respectively in the dividend payout of non-financial firms in Nigeria. Thus, the result is consistent with the empirical findings from literature that argued that managers can use non-current assets (fixed assets) to raise additional debt, in order to increase monitoring by the debt holders (Jensen and Meckling, 1986; Rajan and Zingales, 1995; Booth et al., 2001). Also, Aivazian, Booth, and Clearly (2003) suggest that firms with more tangible assets in relation to total assets will have lower dividend payouts compared to firms with fewer tangible assets in a market where short-term debt is the major source of funding, which is consistent with the agency cost theory.
Industry Effect
The results from Model 1 indicate that both oil and gas and construction/real estate industries are positive and significant at 1% and 5% respectively. The results to an extent support the notion that there is a need for industrial classification in order to detect the impact of the industry effect associated with different regulatory frameworks, growth and risk (Baker et al., 1985; Moh’d et al., 1995). However, the positive and significant results may be due to the ongoing growth in both sectors. For example, the oil and gas sector contributes over 90% of Nigeria’s foreign exchange earnings and is expected to have high payouts in order to compensate investors for volatile stock prices. Meanwhile real estate also pays high dividends because most of its investors are institutions who wish to earn a return on their investment, or huge assets and leverage ratio (National Bureau of Statistics, 2016; International Monetary Fund, 2014). Overall, the industry effect does not significantly change the coefficients of the variables in the models.
4.5 Conclusion
This section summarises the key findings from the regression analysis. The explanatory variables used are ROA, size, debt ratio, growth opportunities, current ratio and asset tangibility. The empirical findings reveal a positive correlation between dividend payout and firm profitability, consistent with signalling theory, which argues that profitable firms pay larger dividends to signal current and future prospects. A positive correlation was also found between dividend payout and size, supporting agency cost theory that size may act as a proxy for access to external capital markets. Larger firms face fewer constraints in accessing external funds from the capital markets and lower costs than smaller firms, and so can afford to pay higher cash dividends (Gaver and Gaver, 1993). Similarly, a positive correlation was found between growth opportunities and dividend payout, which is therefore inconsistent with empirical findings in the literature which argues that a growing firm needs cash for investment, such that growth opportunities may force them to pay a low or even no dividend (Gaver and Kenneth, 1993; Faccio et al., 2001; Baker and Powell, 2012). Furthermore, a negative correlation was found between the debt ratio and dividend payouts, thus supporting the agency costs theory. Liquidity and dividend payouts were also positively correlated, although not significant. This is consistent with signalling theory and with empirical findings in the literature (Manos, 2002; Ho, 2003; Gupta and Parua, 2012). A negative correlation was found between dividend payouts and asset tangibility, again giving support to the agency costs theory and consistent with empirical findings elsewhere (Booth et al., 2001; Aivazian et al., 2003). Finally, analysis of the impacts of time and industry dummies on the dividend payouts of Nigerian non-financial firms shows that time and industry classification effects do not have a significant influence in Nigeria.
5.0 CONCLUSIONS
5.1 Introduction
This section comprises the following: Section 5.2 summarises the main findings of this study; Section 5.3 discusses the implications of these findings, and finally, Section 5.4 explains the limitations of this study and proposes directions for further studies.
5.2 Summary of Findings
The results from section 4 above show that all the variables except growth opportunities were significant and consistent with both theoretical predictions (e.g., agency cost theory, transaction cost theory, and signalling theory) and empirical findings (Gaver and Kenneth, 1993; Faccio et al., 2001; Aivazian et al., 2003; Baker and Powell, 2012). The findings are summarised below in the context of previous theories and empirical findings, and on this basis we evaluate the implications of each of the dividend determinants for the hypotheses formulated.
Hypothesis 1 predicted that dividend payout would be positively correlated with a firm’s profitability. From the results of the pooled OLS regression presented in the summary tables in Section 4.3, it shows that profitability is positively correlated to the dividend payout. Therefore, the result is consistent with empirical findings in the developed countries (e.g. Jensen et al., 1992; DeAngelo et al., 1992; Fama and French, 2000) that found a positive correlation between higher dividend payouts and profitability. Recent empirical studies in the developed countries also found dividend payout and profitability to be positively correlated (Adaoglu, 2000; Aivazian et al., 2003; Al-Malkawi, 2005).
- Firm size was found to be a positive and to an extent significant influence, based on the pooled OLS results summarised in Section 4.3. The result is consistent with some empirical findings that size may act as a proxy for access to external capital markets. Larger firms face fewer constraints in accessing external funds from the capital markets, often at lower costs than smaller firms, and can afford to pay higher cash dividends (Gaver and Gaver, 1993). Other studies have also found a positive correlation between dividend payout and size (Manos, 2002; Travlos et al., 2002; Al-Malkawi, 2005). Although Aivazian et al (2003) found a little evidence to justify the impact of size on dividend payout, overall hypothesis 2, that there is a positive relationship between firm size and dividend payout, is accepted.
Growth opportunities were found to be positively correlated to dividend payouts, contrary to empirical evidence from literature documenting a negative correlation between dividend payout and growth opportunities. The results from this study are therefore inconsistent with empirical evidence from elsewhere that growth potential and dividend payments are inversely related because a growing firm needs cash for investment and therefore can only pay low or no dividend (Gaver and Kenneth, 1993; Faccio et al., 2001; Baker and Powell, 2012). Smith and Watts (1992) likewise found a negative correlation between dividend payout ratios and growth opportunities. Therefore, we can reject the hypothesis 3.
The debt ratio hypothesis (4) predicted a negative relationship between the debt ratio and the dividend payout. Our results confirmed this and were therefore consistent with the literature that argues that agency costs associated with free cash flow problems may be mitigated through issuing debt or paying cash dividends to shareholders (Jensen and Meckling, 1979; Jensen, 1986; Crutchley and Hansen, 1989). Therefore, the hypothesis as formulated is upheld.
Liquidity was predicted to have a positive relationship to dividend payout. Our findings revealed that the liquidity proxy to current ratio and dividend payout was positively correlated, though of limited significance in the models. It has been argued that higher dividend payouts are positively correlated with higher liquidity because firms that are liquid are better placed to pay cash dividends, as no external borrowing (with its associated interest payments) is required, compared to illiquid firms (Manos, 2002; Ho, 2003). Therefore, we cannot reject the hypothesis formulated.
Asset tangibility was predicted to have a negative correlation to dividend payout. Our results are consistent with those in the literature, arguing that managers can use non-current assets (fixed assets) to raise additional debt in order to increase monitoring by the debt holders (Jensen and Meckling, 1986; Rajan and Zingales, 1995; Booth et al., 2001). Aivazian, Booth, and Clearly (2003) also suggest that firms with more tangible assets in relation to total assets have lower dividend payouts compared to firms with fewer tangible assets, in a market where short-term debt is the major source of funding. Therefore, we cannot reject the hypothesis.
Table 5: Summary of Empirical Findings and Theoretical Predictions from Literature
| Variables | Theory | "Theory Prediction" | Empirical Findings |
| Profitability (ROA) | Signalling Theory | Positive | Consistent |
| Size | Agency Cost Theory | Positive | Consistent |
| Growth Opportunities | Transaction Cost Theory | Negative | Inconsistent |
| Debt | Agency Cost Theory | Negative | Consistent |
| Liquidity | Signalling Theory | Positive | Consistent |
| Tangibility | Agency Cost Theory | Negative | Consistent |
-
Effects of Inclusive National Workplace Diversity on Global Competitiveness: TSCS Analysis(page1)

-
Influence of Experiential Marketing on Customers Apparel Purchase: A Study for Indian Organized Apparel Retail Business(page2)

-
Stability of Equity Systematic Securities Risk(page3)
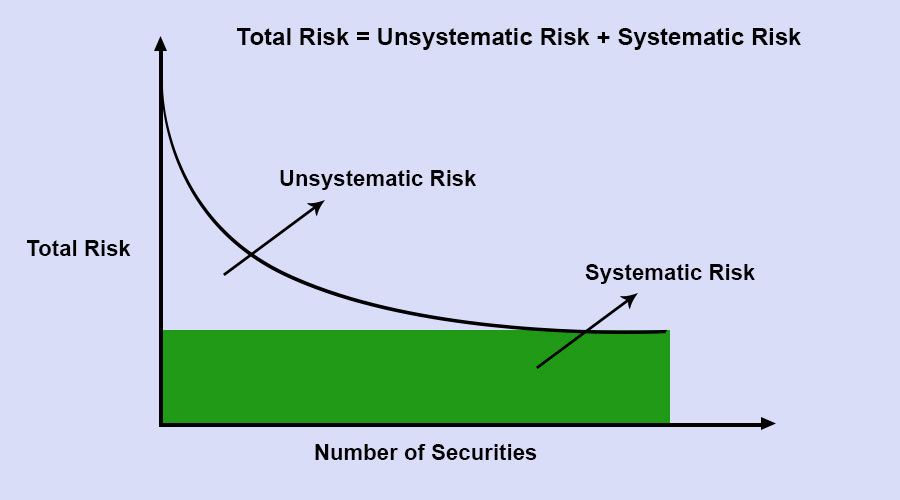
-
Performance Evaluation of Gold-ETFs in India(page4)

-
Determinants of Dividend Policy: Empirical Evidence from Nigerian Listed Firms(page5)

-
Diabetes Control in China: Building a Supervised Machine Learning Diabetes Predictor based on living circumstances of Chinese citizen aged 45 and above(page6)

-
A Study of the Functionally Effective Credit Lending Models of Microfinance(page7)

-
A Study of Interlink-age of Selected Macroeconomic Variables with GDP Growth Rate in India(page8)

-
From Editor’s Desk(page9)